Operational Process Diagramming and Customer Experience Mapping
A picture is worth a thousand words, even when the subject matter is simple and clear. In the complicated case of your company’s internal operations, systems, and workflow or for the subject matter of how your customers experience your service or product lifecycle… a picture is worth even more.
For hundreds of Clients over 23 years, we have continuously handled and distilled complex client information with a myriad of organizational and operational activities – needing to fully understand, synthesize, and communicate a client’s current environment – then designing a better process with better use of technology. We have mastered the craft of visualizing and diagramming the flow of processes, technology, data, and organizational activity.
Visualization Offerings and Example Deliverables
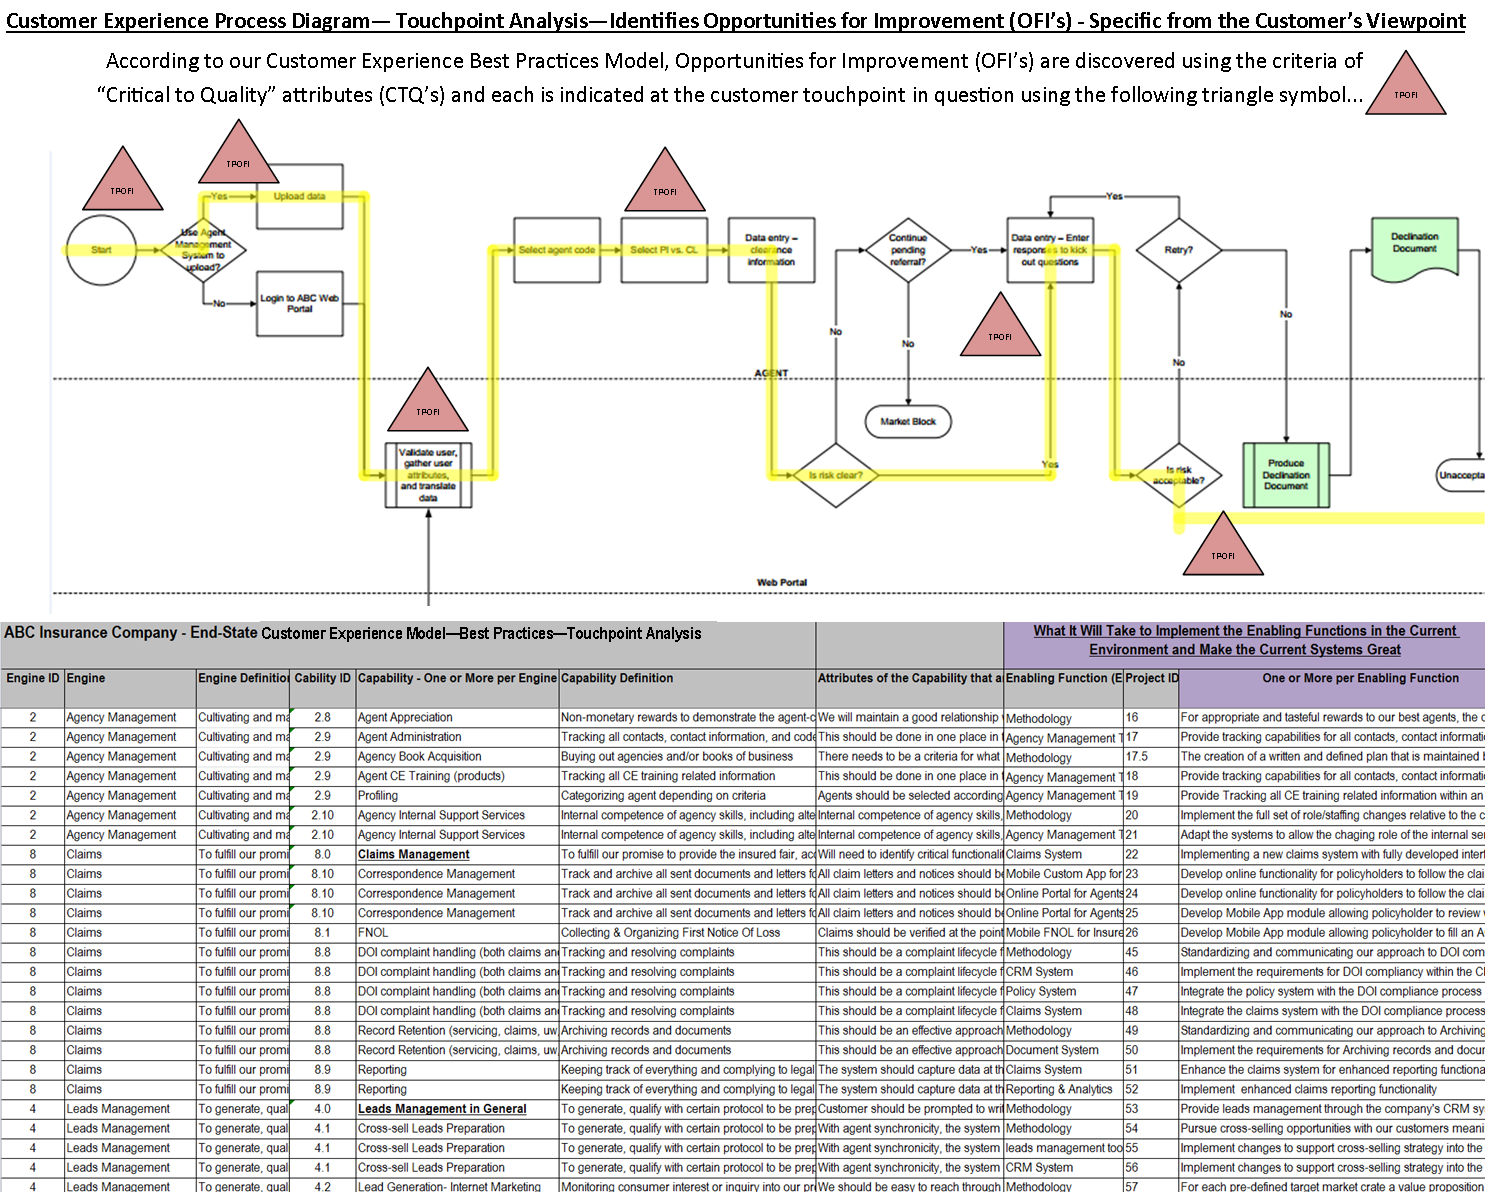
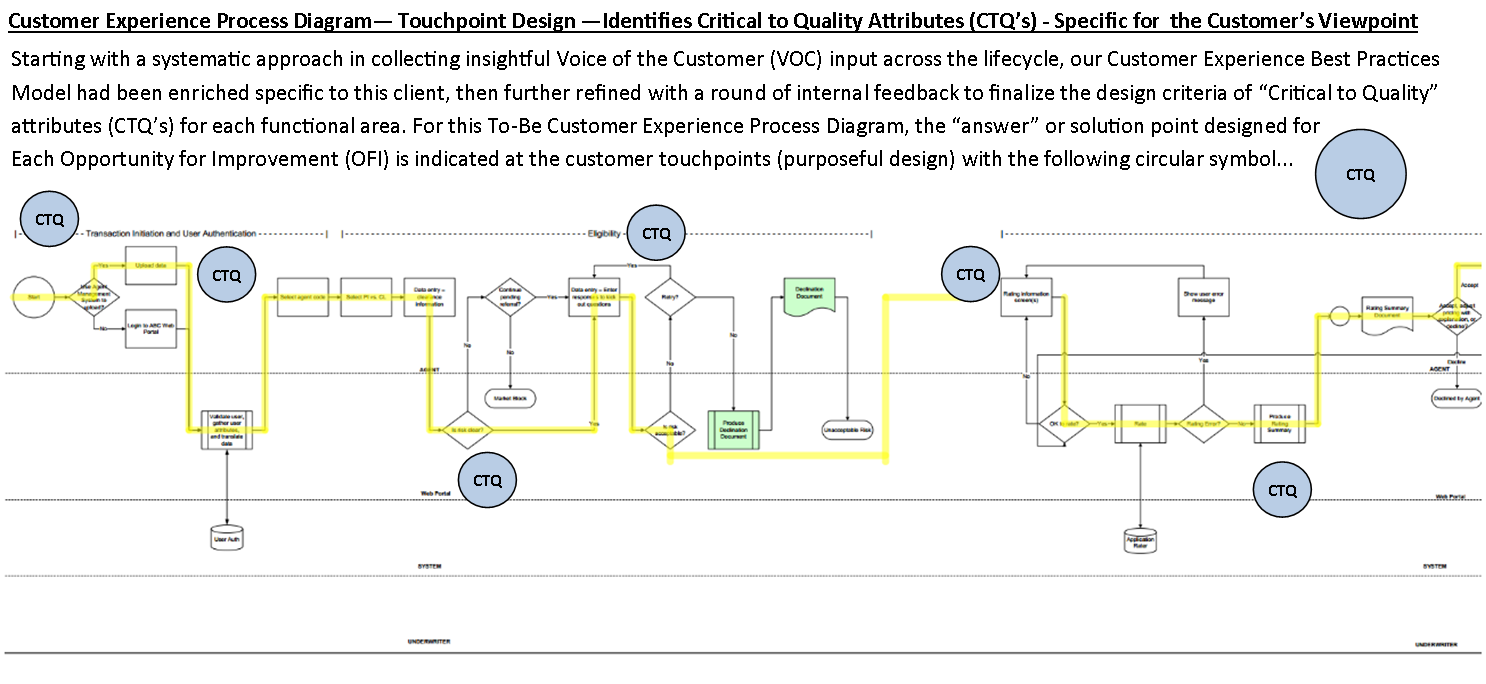
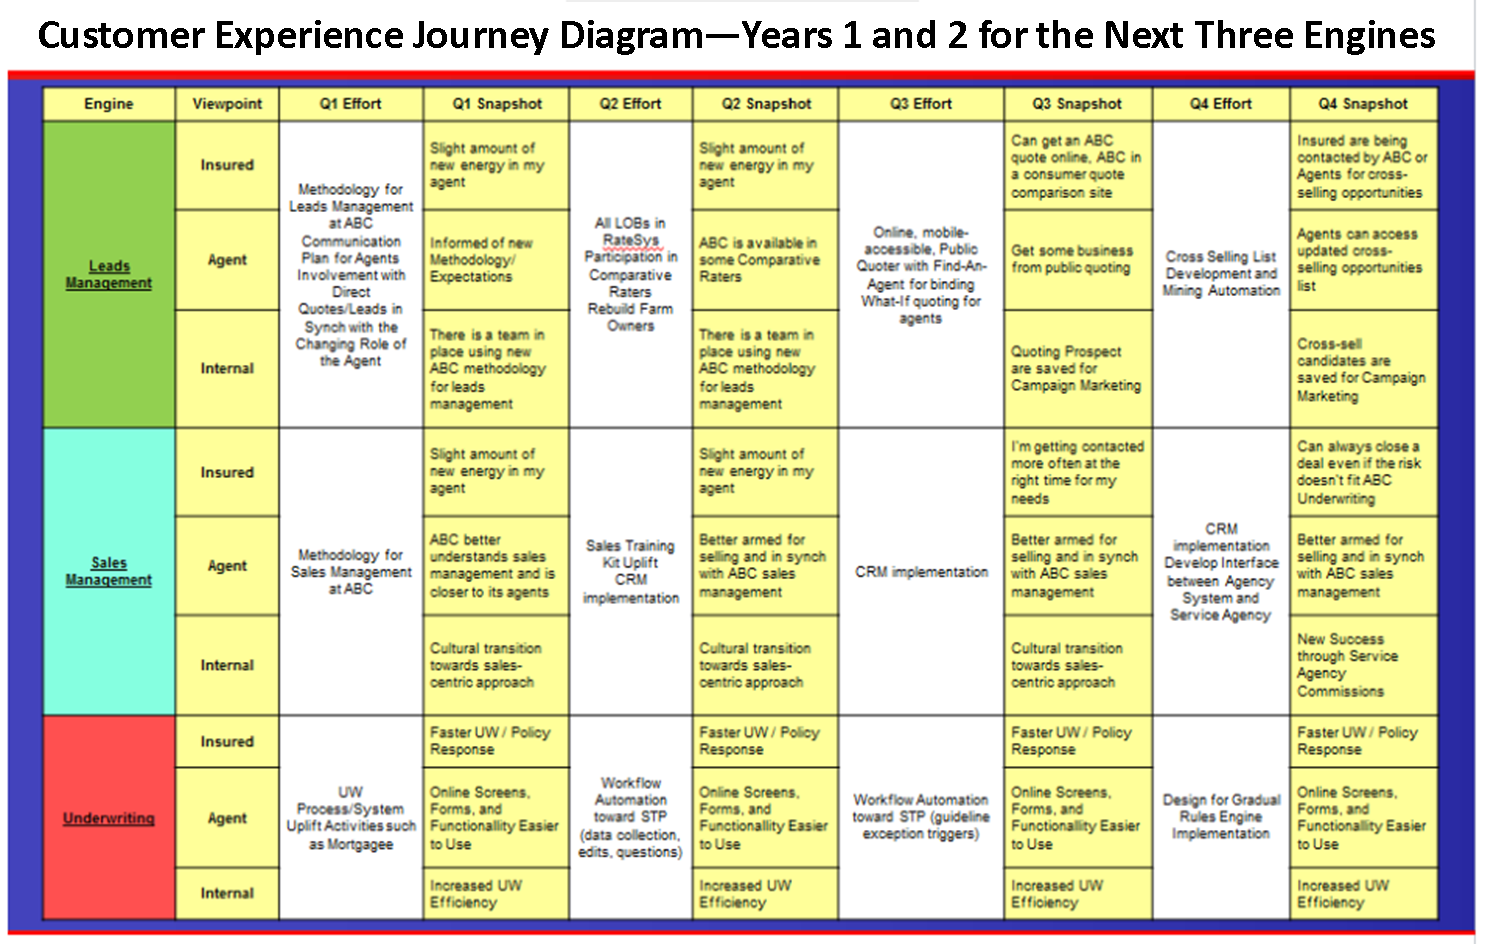
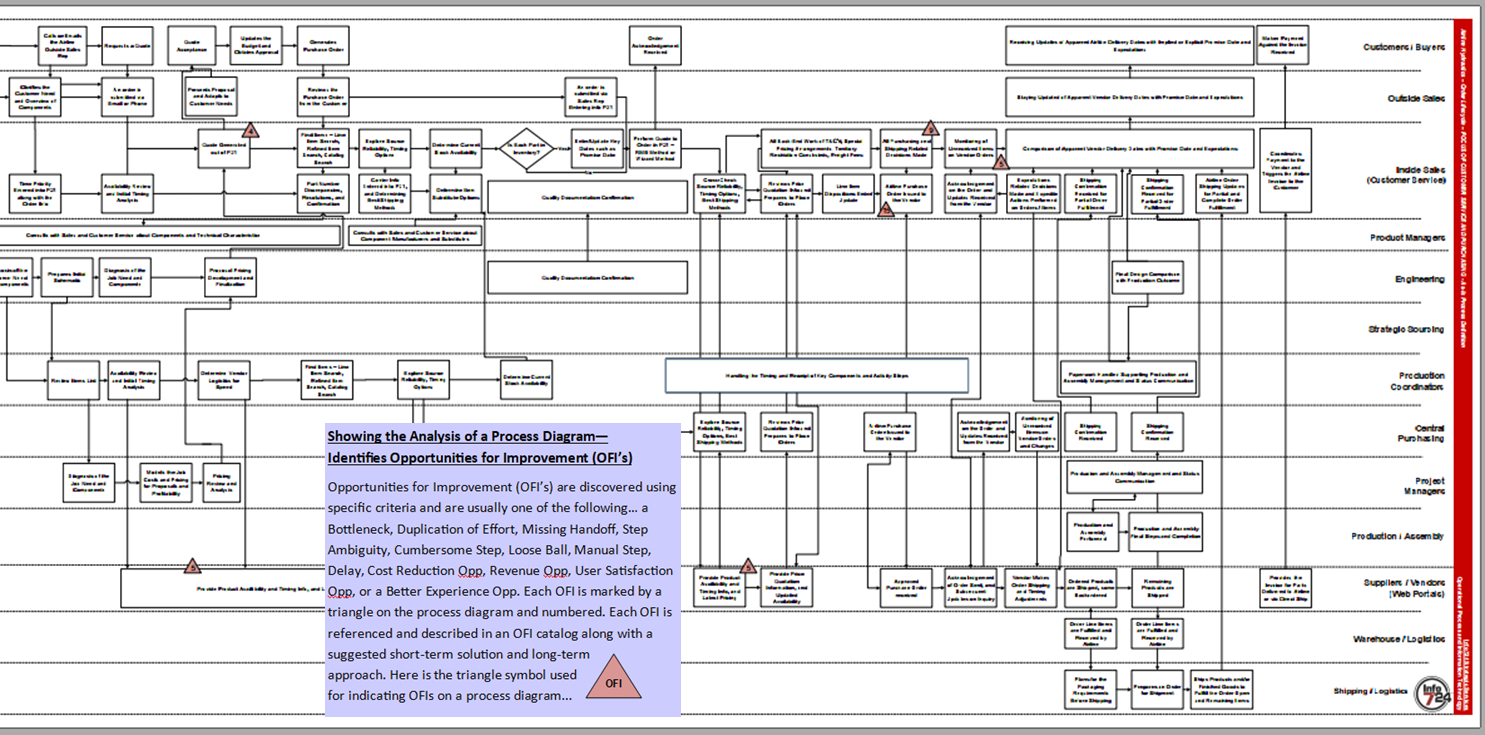
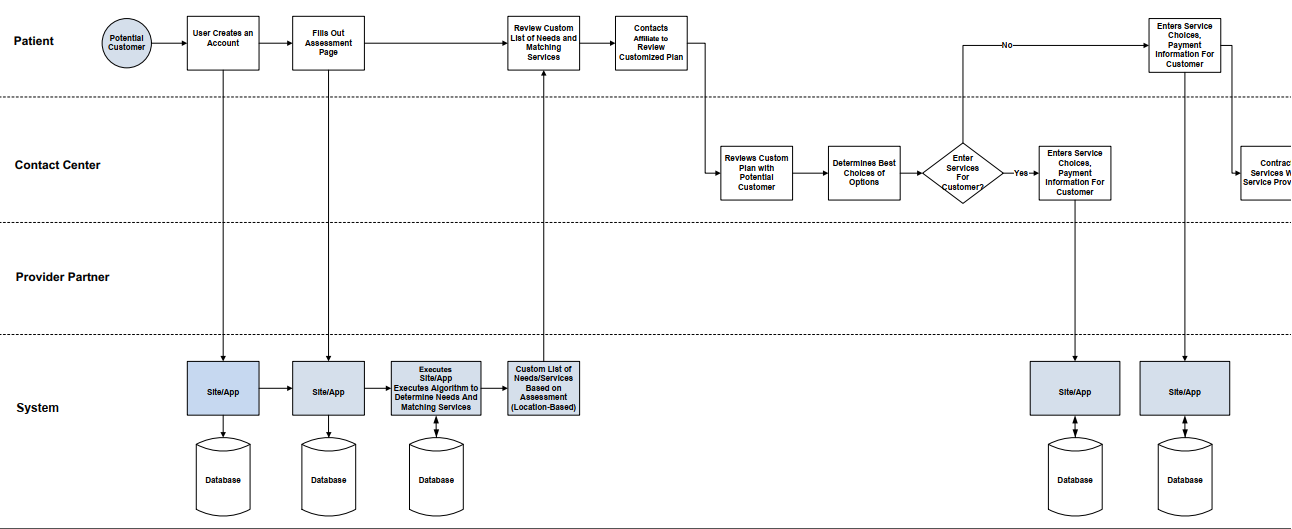
Customer Experience and Customer Journey Diagrams…
Include all Customer Touchpoints from the Customer’s View, with analysis of the Current State, followed by creation of a New Design. We arrive at blueprints made just for your company in which we purposefully design great Customer Touchpoints to achieve Excellence. Our work products show how the capabilities and systems (including Online and Mobile) enable the Customer Experience that your company can provide. Here are some examples…
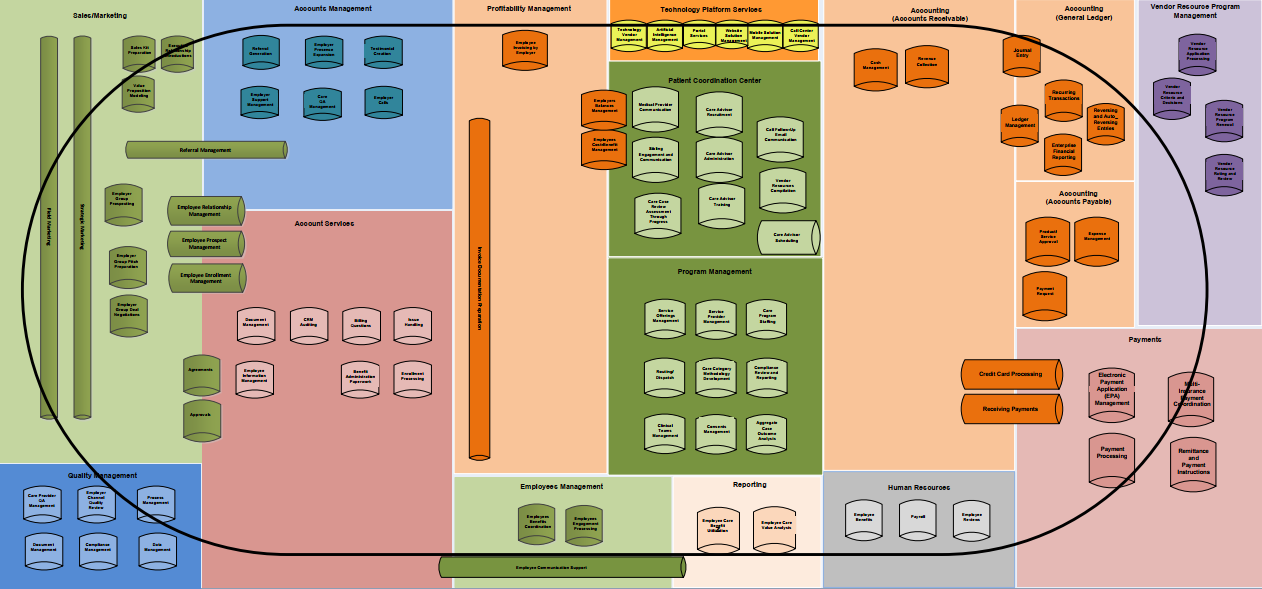
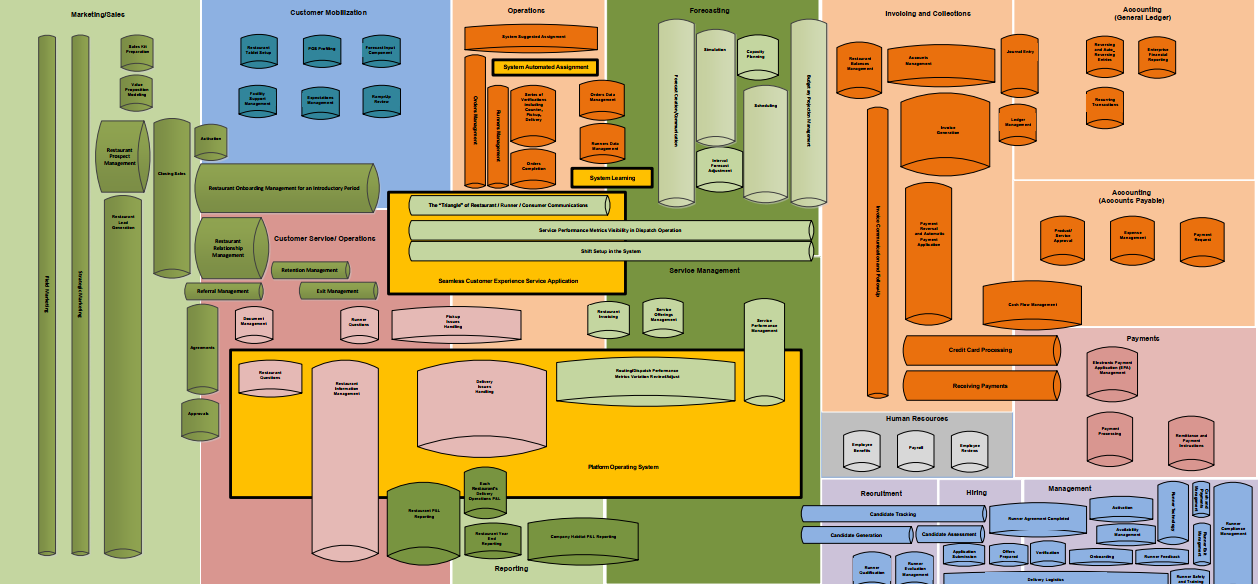
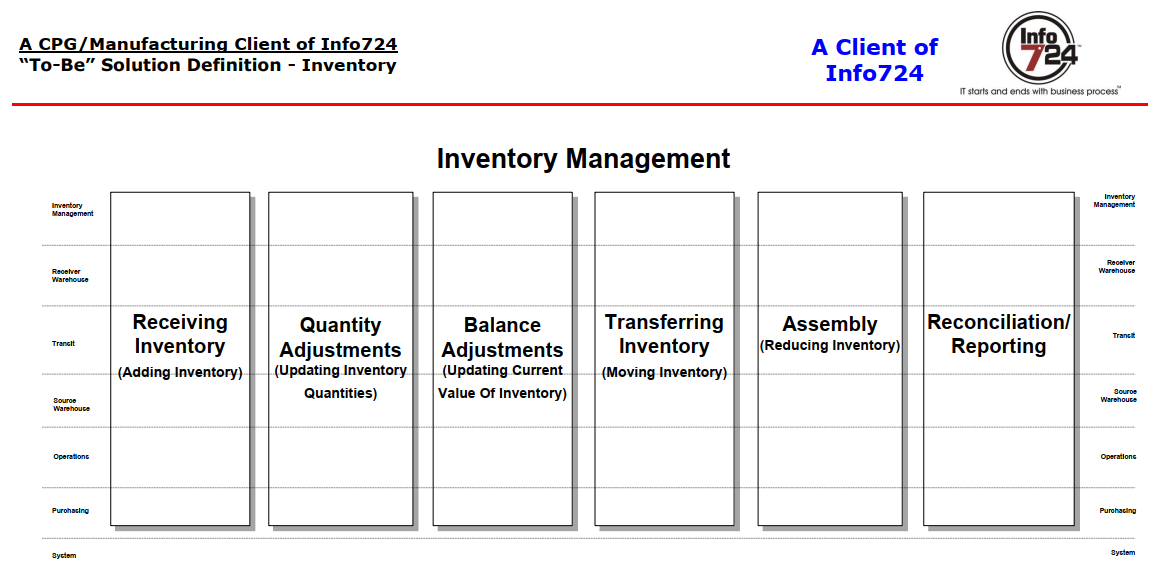
Enterprise Core Diagrams (All Functions of the Company at Level 1)…
Provide a High-Level but Complete View of the Enterprise Capabilities and Core Functions, with analysis of the Current State and a New Design which provides a sensible framework for Transformation. Our blueprints become a key input for your business strategy and usually serve as the starting point for your IT developers including those working on your Online and Mobile platforms. Here are some examples…
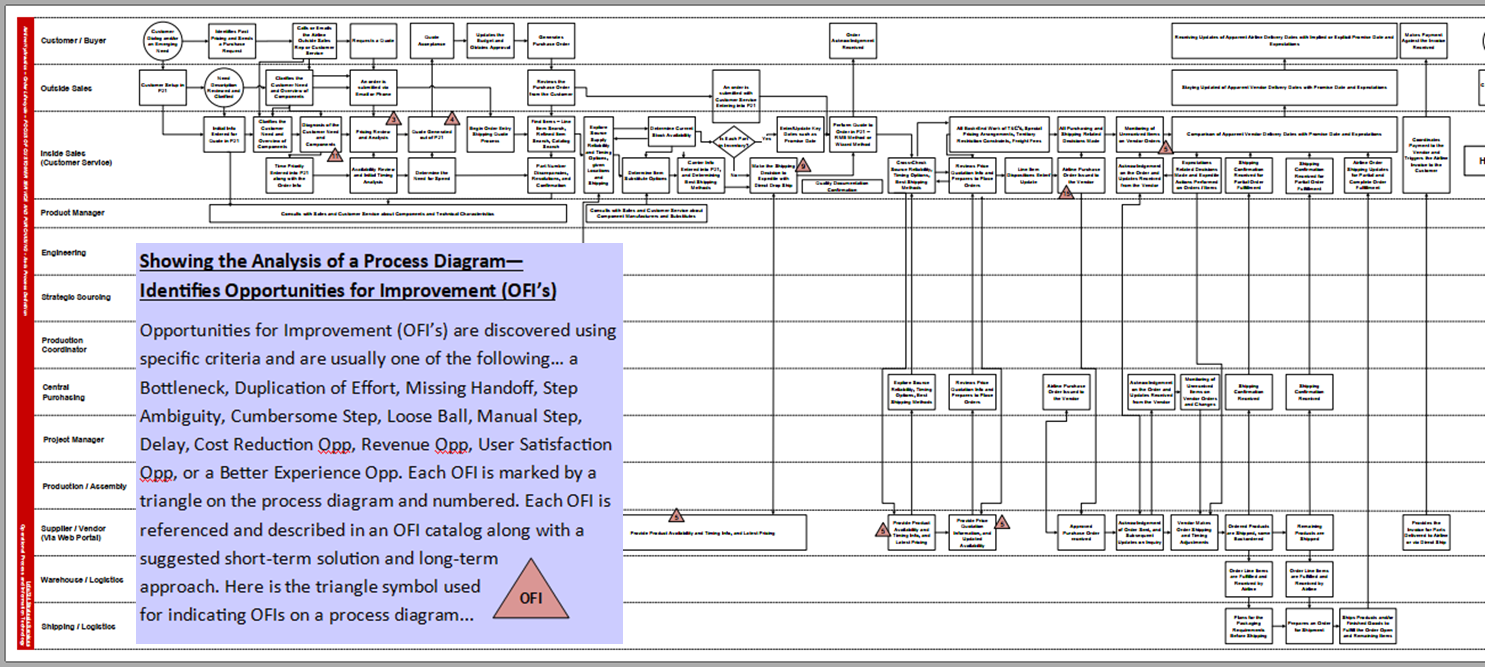
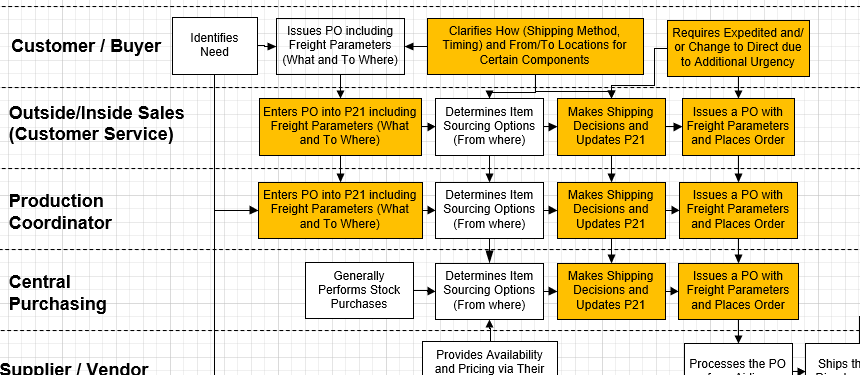
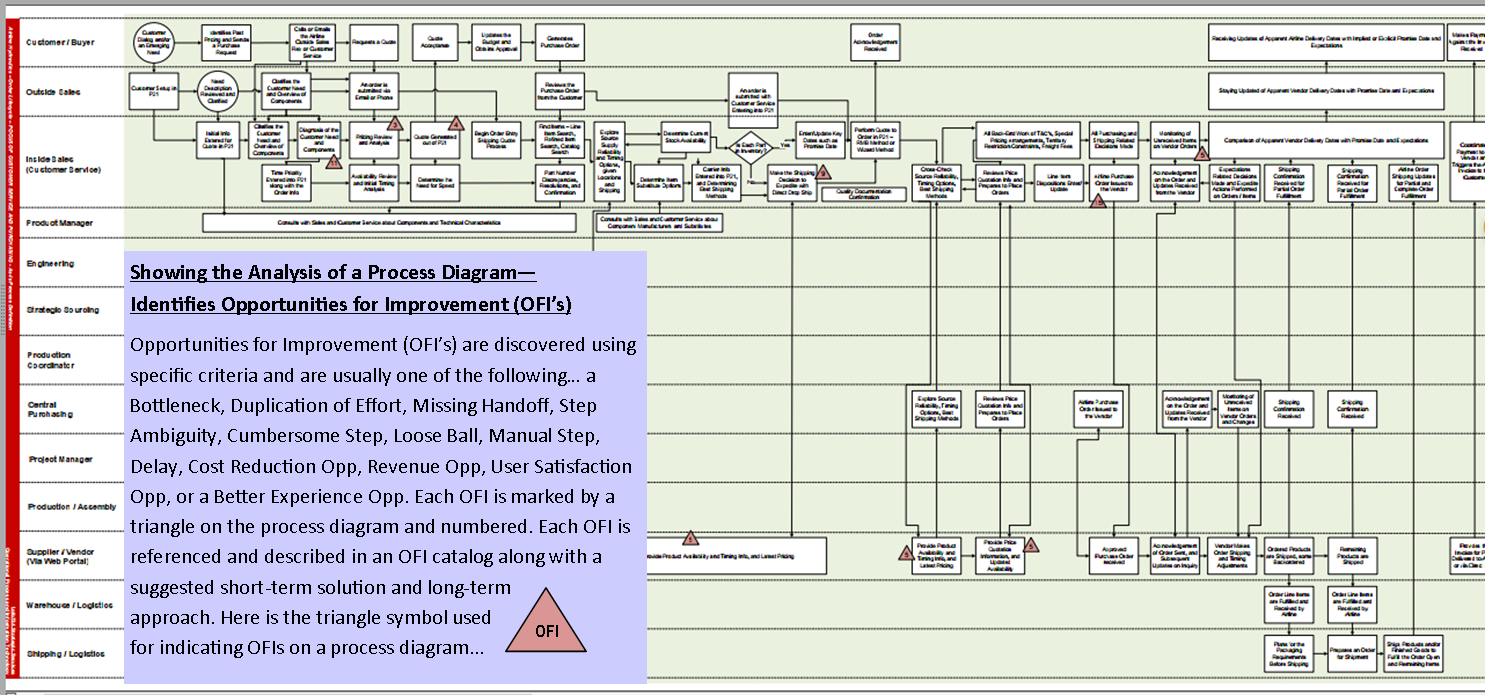
Enterprise Process Diagrams (All Functions of the Company at Level 2 or Level 3)…
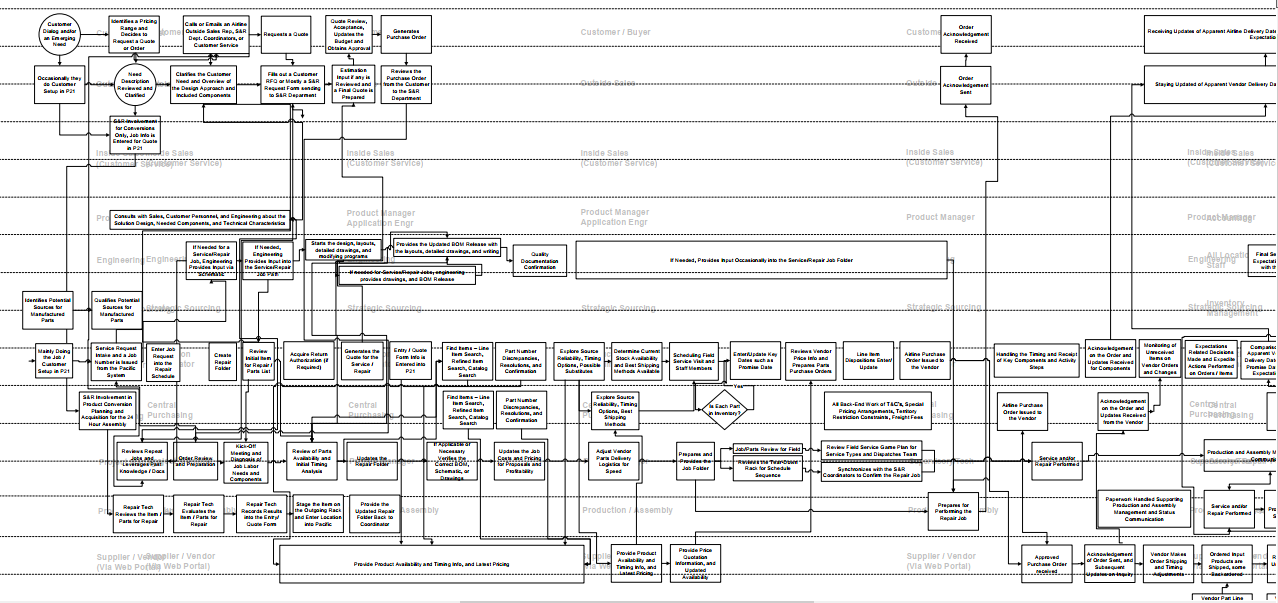
Provide a Full View of the Enterprise Operations, Technology, Workflow Roles, and Capabilities in Detail, with deep analysis of the Current State. We’ll also create newly designed blueprints for your company to fully leverage all of the modern technologies with your current IT including Online and Mobile. Here are some examples…
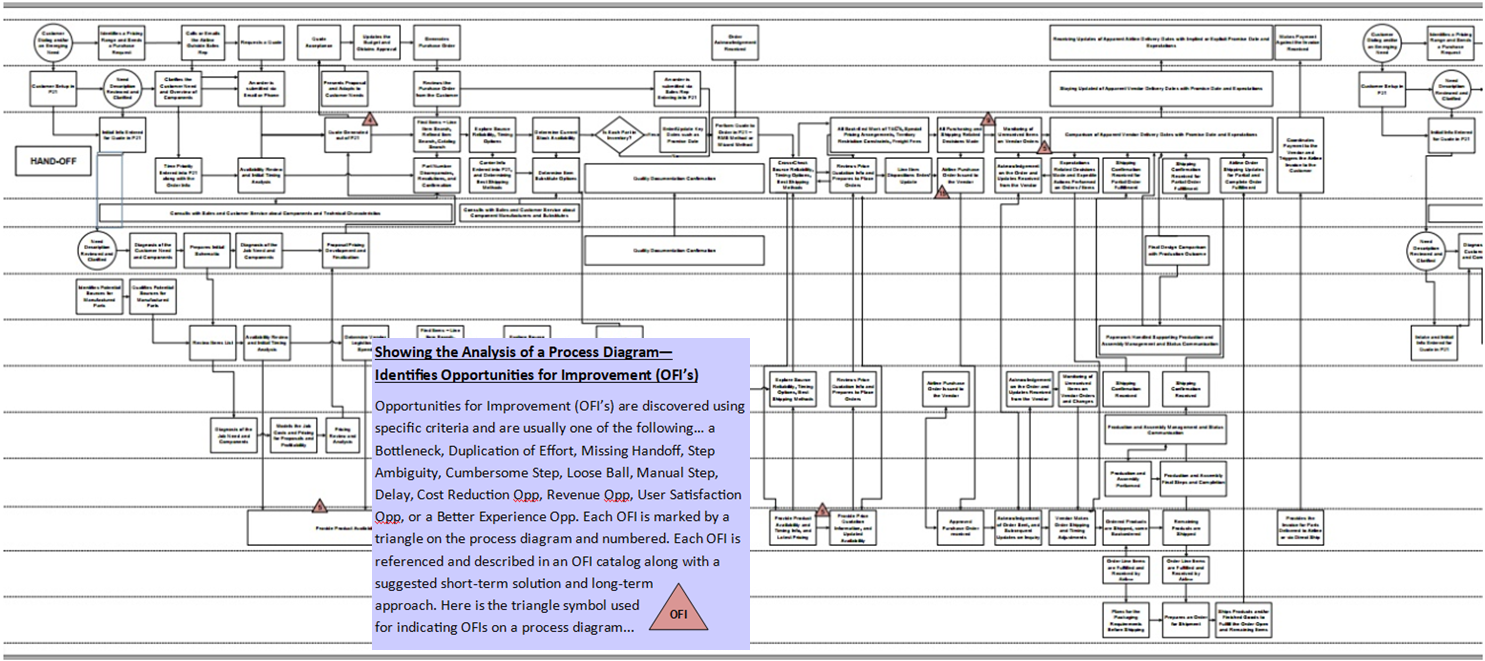
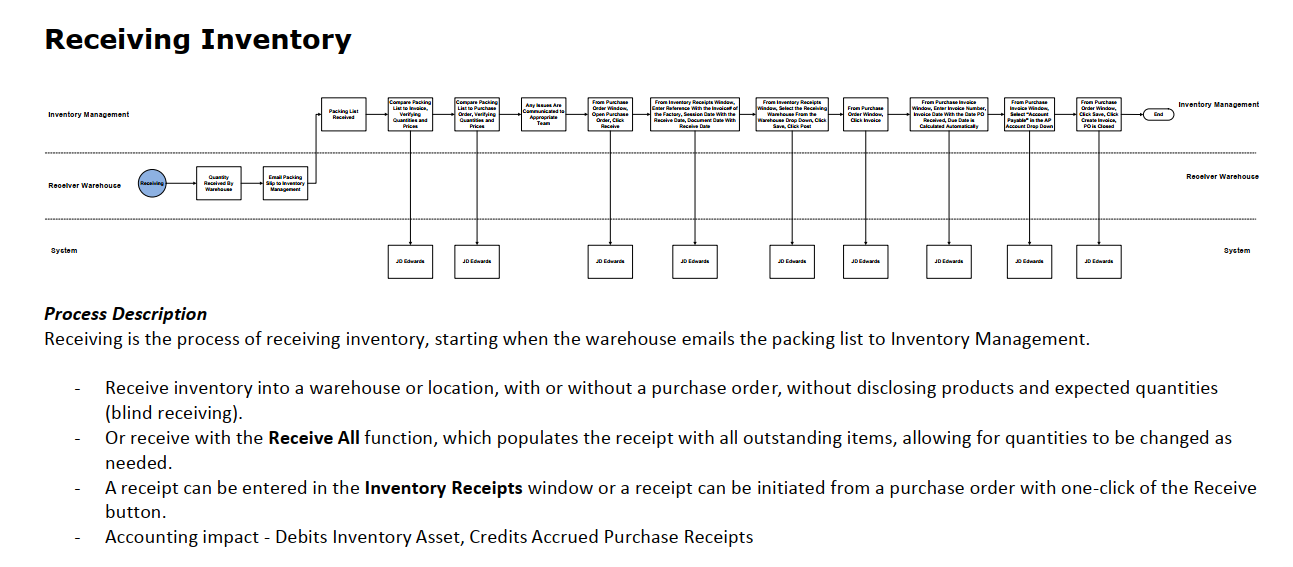
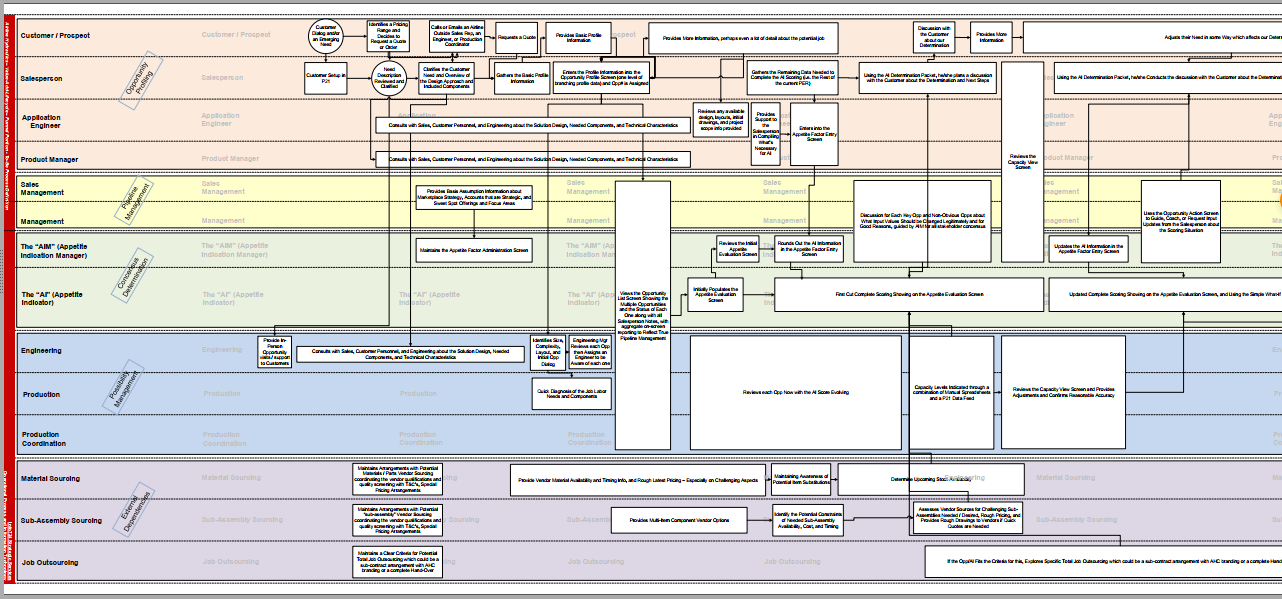
“Hi-Def” Process Diagrams (One or More Functional Areas of the Company in HIGH DEFINITION aka “Hi-Def”)…
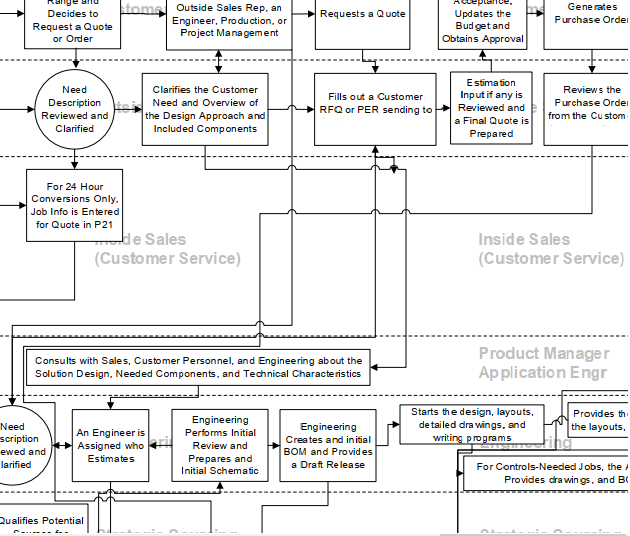
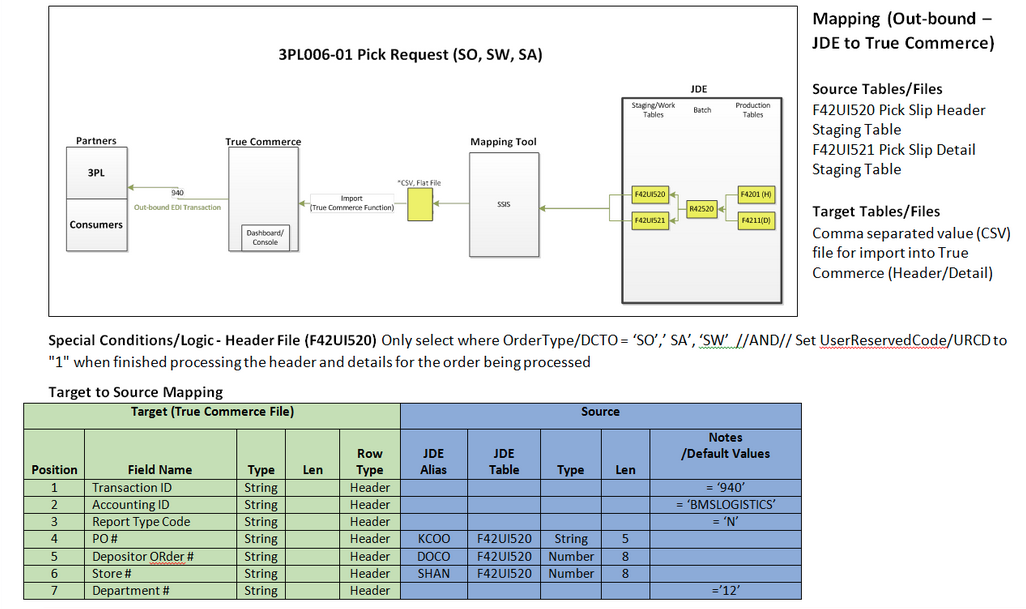
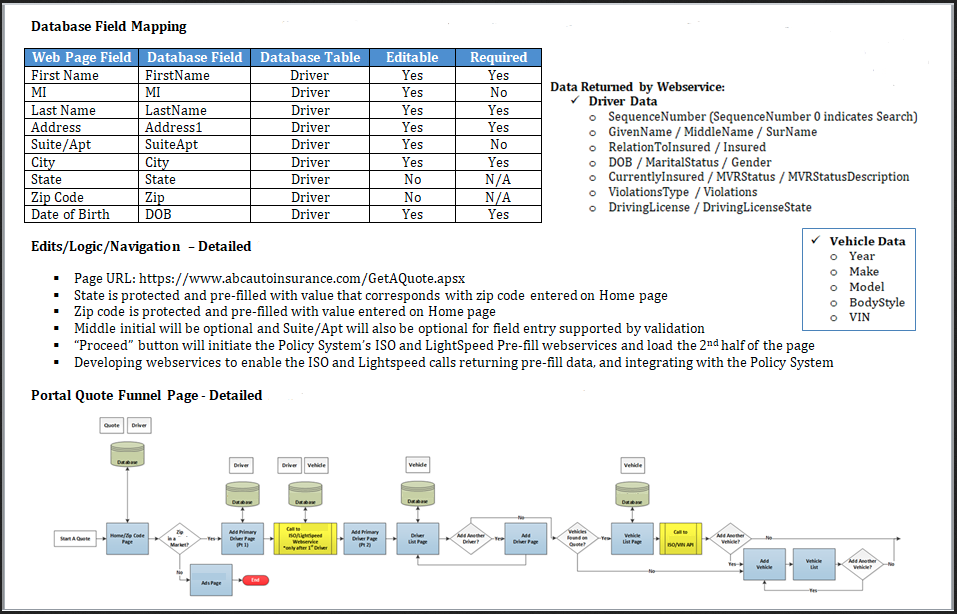
Provide a deep and up-close view of all Workflow Steps including key System Screens, Business Rules, Reports, Roles in Detail, along with a deep and complete analysis of the Current State. Then we’ll create blueprints of a new detailed design to show you how you can fully leverage modern technologies expanding from your current IT including Online and Mobile. Here are some examples…
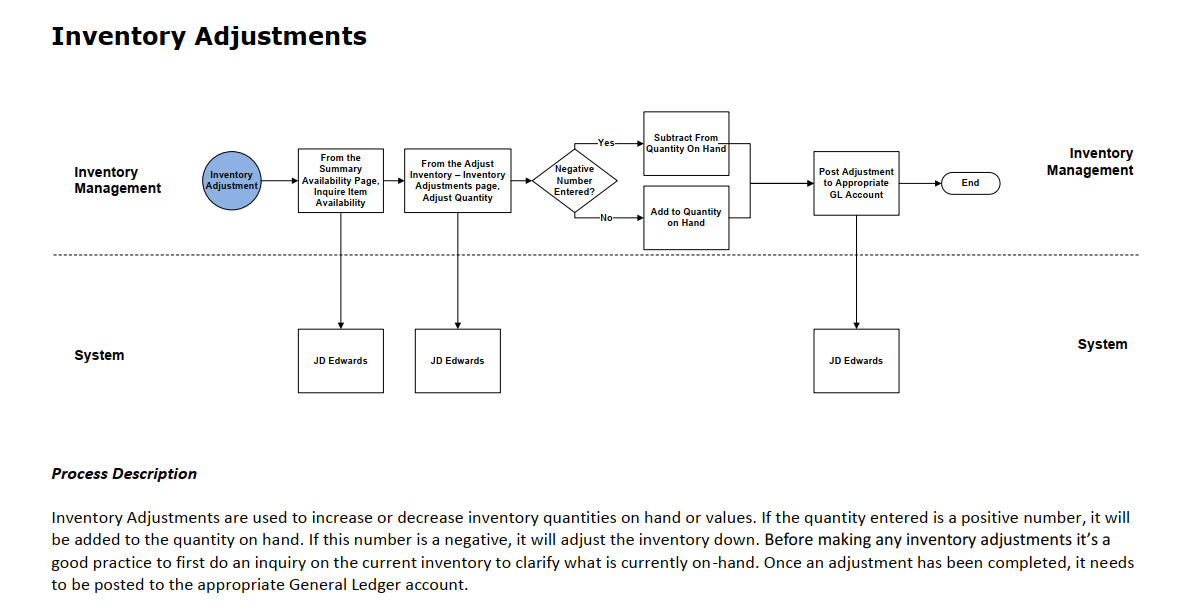
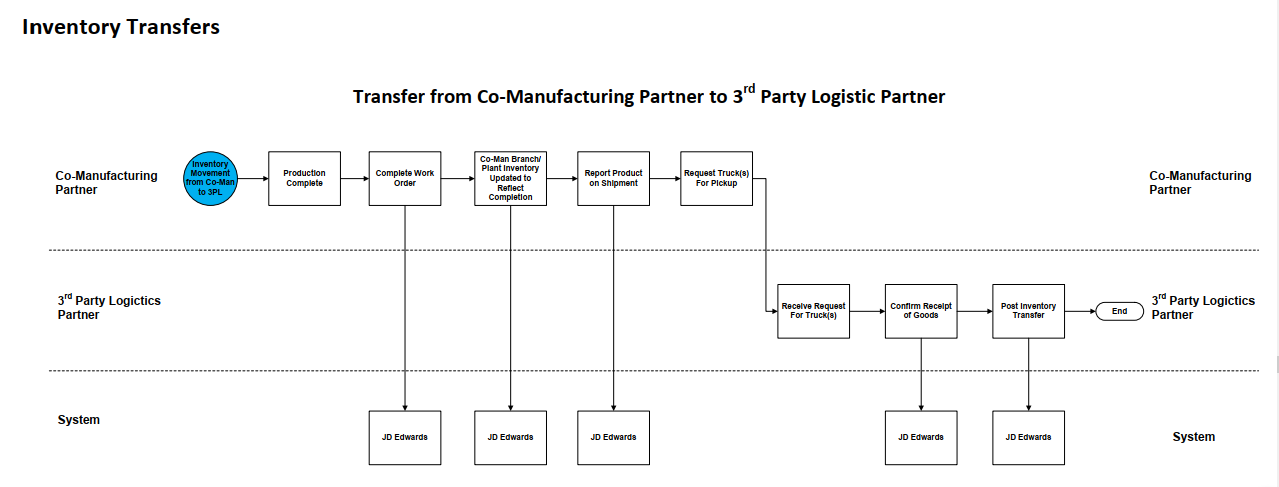
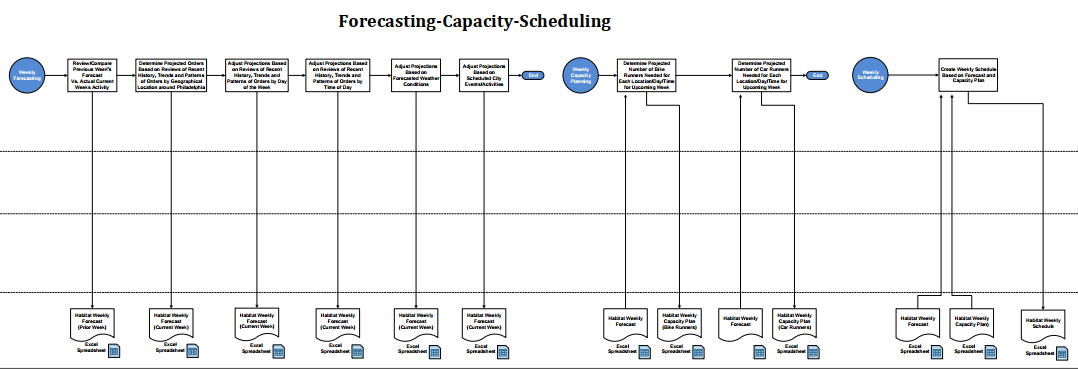
Process Diagrams (One or More Functional Areas of the Company at Levels 1, 2, or 3)…
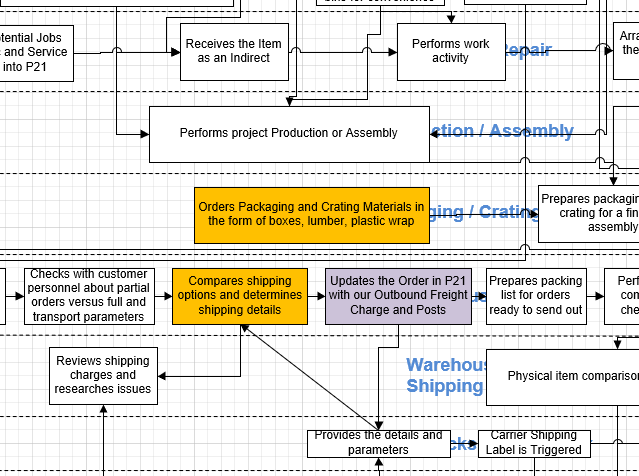
Provide a Full View of Operations, Technology, Workflow Roles, and Capabilities in Detail, with rigorous analysis of the Current State followed by our blueprints for your transformation. Our suggested New Design shows you how to fully leverage all modern technologies and data analytics with your current IT group including Online and Mobile components. Here are some examples…
System Diagrams (Full Enterprise with all Applications or Deep Focus in One or More System Areas)…
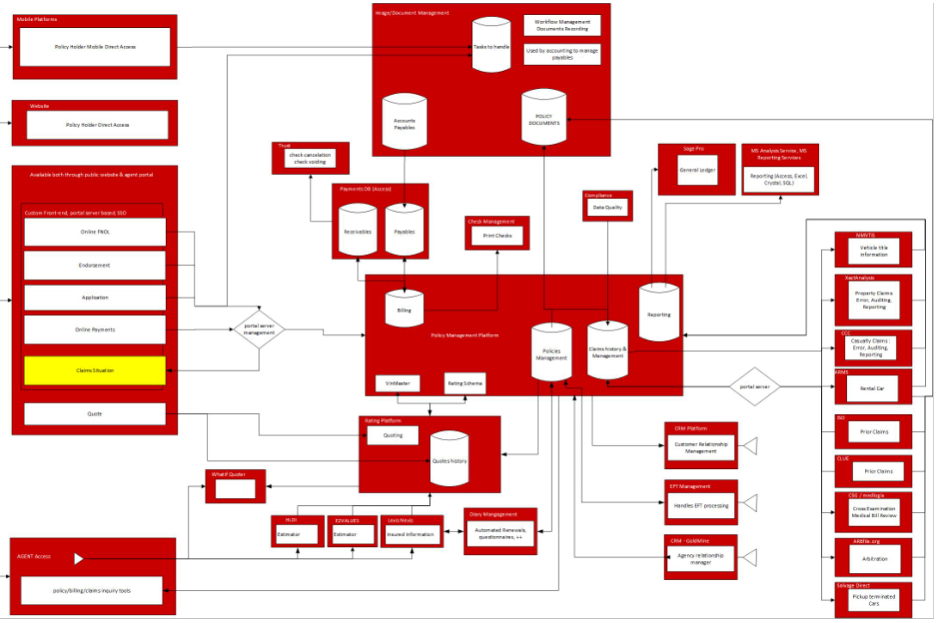
Provide a Technology View of your company’s Key Systems and the Primary Data Flow across the Enterprise or Deeply for One or Two System Areas, providing a framework for business and Technology Transformation including all Online and Mobile components. The Current State work product also serves as a basis for updating the internal Application inventory and is very useful for IT business continuity planning. Here are some examples…
To learn more about our specialty in Visualization please call us at 215.479.0724 or use our Contact page to start an initial conversation together.
